The Mathematical Transformations project was designed to give me a new look at the ever-changing world all around me, from a mathematical perspective, of course. Namely, I took a closer look at exactly how things change. A mathematical transformation is any quantity (distance, rate, amount, time, etc.) that changes consistently. The purpose of this project was to teach the class about linear functions. Therefore, we had to go out and find a linear mathematical transformation (of which there are many). But wait; there's more! To get us to explore, we also had to find a non-linear transformation. Ideally, the two would relate, but that was not a requirement. Once we had found the transformations, we would gather data about the transformations and graph them. Then, the displayable artifact at Exhibition was our creative piece(s), which would embody our transformations in some way.
For this project, I worked with a partner, and because the project had to be displayed at Exhibition where we were already working in partnerships, I was put with my Exhibition partner from my class, Jacob Fikes. We had different ideas for what we wanted to do. He had a few ideas that he was interested in exploring that were all over the map. Mine were all science-oriented. So, we compromised: he chose the linear transformation, and I chose the non-linear transformation.
LINEAR TRANSFORMATION
The transformation that we originally tried to do - the amount of kilowatt-hours of electricity used v.s. the amount of money paid - ended up being non-linear, so we went with another choice of Jacob's which we knew would be linear: temperature conversion from fahrenheit to celsius. It also turned out to be very easy to obtain data for this transformation, since of course the formula - C = (F - 32) • 5/9 - had already been invented. We found it via a simple Google search. All we had to do was plug fahrenheit values into the equation to come up with our data, which is represented in an input/output table below.
Fahrenheit Temperature (x, input) Celsius Temperature (y, output)
0 degrees -17.8 degrees
16 degrees -8.9 degrees
32 degrees 0 degrees
48 degrees 8.9 degrees
64 degrees 17.8 degrees
80 degrees 26.7 degrees
0 degrees -17.8 degrees
16 degrees -8.9 degrees
32 degrees 0 degrees
48 degrees 8.9 degrees
64 degrees 17.8 degrees
80 degrees 26.7 degrees
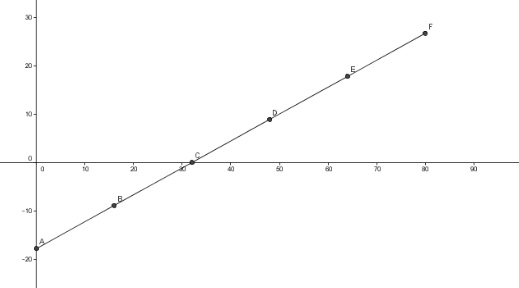
Only based off of only the input/output table, it is clear that our relationship is linear. Our input and output values increase by constant numbers: respectively, 16 and 8.9. This means that there is a constant slope, which makes it linear. Another way to tell is in the equation. There is no exponent in the equation; therefore, it must be linear. Using this input/output table, we graphed the equation in a graphing program called GeoGebra (which was also used in our Mathematical Model of Me project). The graph is shown below. This is the final proof that the transformation is linear.
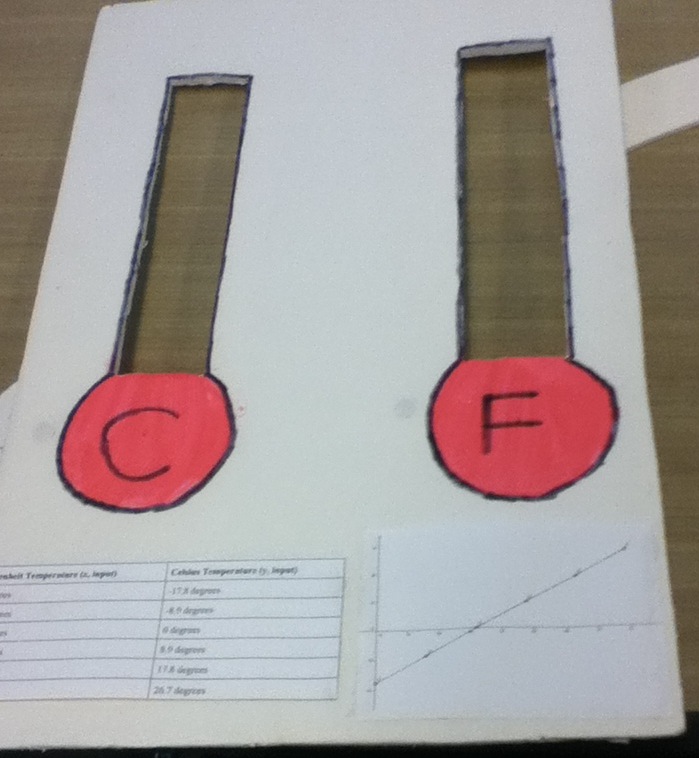
For our linear creative piece, we chose to paint two thermometers on a piece of foam-core board. On the back, we made two vertical sliders, painted red, and a belt drive system to move the sliders up and down. When you turned a wheel on the side, both thermometers raised and lowered their sliders, and the temperatures changed! That's not all, though. We incorporated the equation into the creative piece. The fahrenheit thermometer started 32 degrees above the celsius thermometer, as per the y-intercept of the equation, and the belt drive system had a mechanical advantage of 5:9, as per the slope. You can see a picture above.
NON-LINEAR TRANSFORMATION
We decided to connect our non-linear transformation to our Physics exhibition project by doing a transformation with our SA-7 surface-to-air missile: the distance of the missile from the ground in a vertical flight v.s. elapsed time. To obtain data, we first found the equation by taking physics equations that we had learned throughout the year and making a series of substitutions.
We assumed that the thrust the missile would put out would be approximately 5,000N. We also knew that the missile's mass was 9.8kg, that the missile's fuel mass was 4.2kg, and that the missile would use up all of its fuel in 15sec, so we determined that the missile's rate of fuel loss was 0.28kg/sec. We knew that the rocket's mass at any given time was 9.8kg - 0.28kg/sec • time, that mass = acceleration / force, that acceleration = velocity / time, and that velocity = distance / time. When we made our substitutions, we came up with f = (9.8 - 0.28t)a ---> f = [(9.8 - 0.28t)v]/t ---> f = [(9.8 - 0.28t)d]/t^2 ---> ft^2 = (9.8 - 0.28t)d ---> d = (ft^2)/(9.8 - 0.28t). Upon substituting x for time, y for distance, and 5,000 for force, we obtained the equation y = (5,000x^2)/(9.8 - 0.28x). Using this equation, we were able to complete an input/output table, as shown below.
Elapsed Time (x, input) Distance from the Ground (y, output)
5 seconds 14,881 meters
7 seconds 31,250 meters
9 seconds 55,632 meters
11 seconds 90,030 meters
13 seconds 137,175 meters
15 seconds 200,893 meters
5 seconds 14,881 meters
7 seconds 31,250 meters
9 seconds 55,632 meters
11 seconds 90,030 meters
13 seconds 137,175 meters
15 seconds 200,893 meters
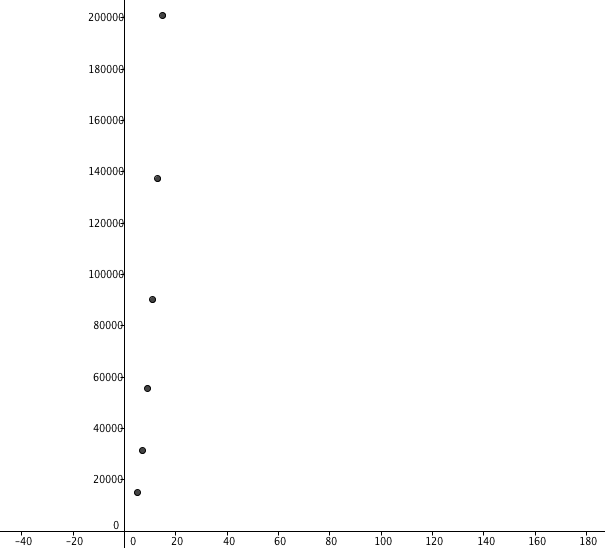
It is possible to tell whether a relationship is linear, you can look at the slope, and this goes in both directions. The best way to tell that this relationship is not linear is to look at its slopes. The differences between the x values are constant, but the differences between the y values begin at 16,369 and continue on to 24,382 and 34,398. An inconstant slope makes for a non-linear relationship. Of course, there's an easier way to tell: the equation has an exponent in it! Still don't believe me? Take a look at the graph of the input/output table.
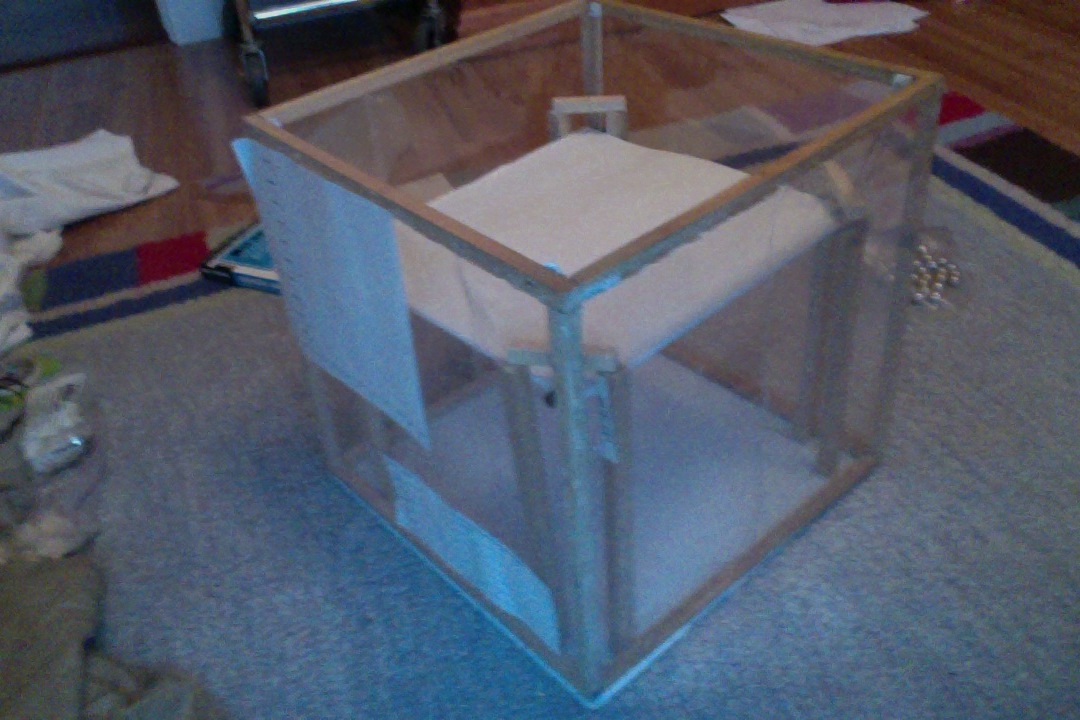
Our creative piece for our non-linear transformation was rather different. It did not show our transformation directly, other than having cutouts of our input/output table and graph on it. Rather, because Newton's second law (force = mass • acceleration) was influential in our equation, we decided to create a device that would demonstrate it. Our device was simply a box that had a corrugated-plastic platform with four rubber bands planning the distance between it and the walls of the box. When the platform was pressed to the bottom of the box, the rubber bands applied a force to accelerate varying masses. It was clear when watching the device work that the greater the mass on the platform was, the less the acceleration was; actually, they varied inversely. A picture of our creative piece is, again, at the top of the page.
REFLECTION
I was very pleased with the way that the belt drive system worked, especially after I was told multiple times that we couldn't build a belt drive system out of foam-core, poster-board, velcro, toothpicks, and two plastic K'Nex wheels. But we did, and proved the doubters wrong. Unfortunately, one of the sliders tore on the side, and it no longer moved with the belt drive system, but the system itself worked demonstrably for Exhibition night. We did have some difficulties creating the belt drive system, due to the materials. Our earlier attempts using rubber bands were unsuccessful for several days, due to the fact that the band kept slipping. Normally, the belt has ridges that fit into groves on the wheels, but we could not do that with our resources. The idea of using velcro for the belt and covering the wheels with velcro - hooks for both - came on the day before the project was due, and it worked. The problem was that a lot of time was wasted that could have been spent on other important tasks.
The Habit of a Mathematician that we used most effectively in this project was probably the "Collaborate and Listen" habit, because we were able to split up the work in researching our two transformations very evenly. I do wish, though, that we had split up the work for the actual building more evenly. The Habit of a Mathematician that we should have used more effectively is "Describe and Articulate," because when we were choosing our linear relationship Jacob actually selected a different choice from both that we tried. Unfortunately, however, I did not understand what he meant, and I did not think that there would be any actual function in what he was referring to. It was only later, two-thirds of the way through the project, that I realized what he actually meant, and it would have worked. At that point he agreed that it was too late to switch.
 RSS Feed
