The Graph my Motion project was really a mini-project; we only spent four days on it. For this mini-project, we shot a short video of something in motion, exhibiting distance covered, elapsed time, velocity, and acceleration. Then, we made two (three for the challenge option) motion graphs and put everything together in an iMovie video. You can see our video below.
PROJECT DESCRIPTION
My group shot a video of my cylindrical pencil sharpener rolling along a flat surface, up a ramp, and then down that same ramp and back along the flat surface. We marked off every half-meter along the course with Scotch tape to make it easier to determine the pencil sharpener's speed. After we had successfully played our little game of skee-ball with the pencil sharpener, we uploaded it to iMovie, and got the times we needed to determine the pencil sharpener's speed.
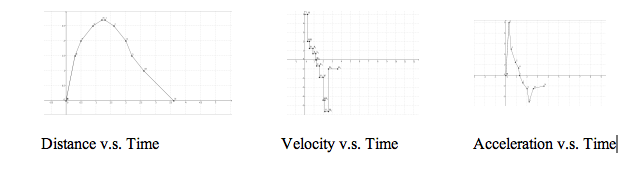
The next step was graphing. For a motion graph, the x-axis always represents elapsed time, but the y-axis can represent a quantity or a rate. There were three types of motion graphs that we made: distance v.s. time, velocity v.s. time, and acceleration v.s. time. In a distance v.s. time graph, the x-axis represents distance covered. In a velocity v.s. time graph, the y-axis represents velocity, or speed in a given direction. In an acceleration v.s. time graph, the y-axis represents the rate of change in the pencil sharpener's velocity, or meters per second squared. Pictures of our graphs are below.
After graphing, we had to take pictures of the graphs and upload them into iMovie. After that, everything else was just fun: adding captions and titles, and putting music into our video. Finally, we had a class exhibition, where Mr. Schwartz played all of our videos and we graphed everyone else's videos. The graphs were shown after we attempted to make them ourselves so that we could check our work against them. Now, if you look below, you will see our distance v.s. time, velocity v.s. time, and acceleration v.s. time graphs.
PROJECT REFLECTION
1. What went well in this project?
We caught a lucky break when we were making the graphs. One of my group members was in charge of making the velocity graph, and I was going to make the acceleration graph. I went home, and looked at his velocity graph, and saw that he had accidentally made the acceleration graph, so I made the velocity instead. The next morning in class, he told me that there had been a serious mix-up and that he had done the velocity graph incorrectly. It was extremely fortunate that he made just the right error that allowed us to still use his graph, and we all had a good laugh about it afterwards.
2. What struggles did you have and how did you overcome them?
We had some difficulties in getting the workload divided evenly among the three members of our group; one of the group members ended up with a rather lighter workload than the other two. The problem was that this project was meant more for two-person groups; a group member could either do graphing or video editing. He played a role in the film, which was just fine, but other than that there wasn't really much we could do.
3. What things did you do well concerning work ethic and what could you improve on?
Our group worked very efficiently. We were able to film our motion clip in the first day of filming, and we were able to complete our video on the final day, when we were focusing on editing. Our problem really lay in the second day of filming; we didn't need to film, so we just sat around. Really, we should have started editing on that day; next time I work on a problem like this, I am going to avoid wasting a perfectly good class period like that at almost any cost.
4. How would you change this project?
Honestly, the final product almost couldn't have been better. The only thing that I would change about our video, were I able to do the project over again, would be to make a coordinate point at every meter the pencil sharpener passed, as opposed to every half-meter, as this would have resulted in many fewer data points and would have made it much easier for the rest of the class to graph our motion.
 RSS Feed
